Updated & refreshed content:
Updated & refreshed content:
But those hours on end you spent figuring quartiles and the median of 100 different numbers in a row for statistics? There are still days I wake up in a cold sweat dreaming of sorting and number counting by hand! Well the days of laboring over tiresome statistical calculations are done with our five number summary calculator – which turns an arduous process into a single click.
Five Number Summary Calculator
This powerful calculator will calculate the minimum, Q1, median, Q3 and maximum values from a data set in no time at all – which can make calculations feel like a breeze!
Key Features
• Instant five Number summary analysis: Minimum, Q1, median, Q3 and maximum in seconds • Flexible input format: Simply type numbers separated by commas – no need for convoluted formatting • Supports any dataset size: Whether it’s a tiny sample or large-scale dataset, this tool expands to accommodate your data needs • Accurate Quartiles Calculations: Implements standard statistical methods for accurate Q1 and Q3 values • Clean visual output: Present your results clearly in an easy-to-read format • Mobile friendly interface – focus where you need to be wherever you are!
How to Use the Five Number Summary Calculator
Surprisingly, using this tool is easy my nephew even got the hang of it in his middle school mathematics homework! Here’s your simple step-by-step guide:
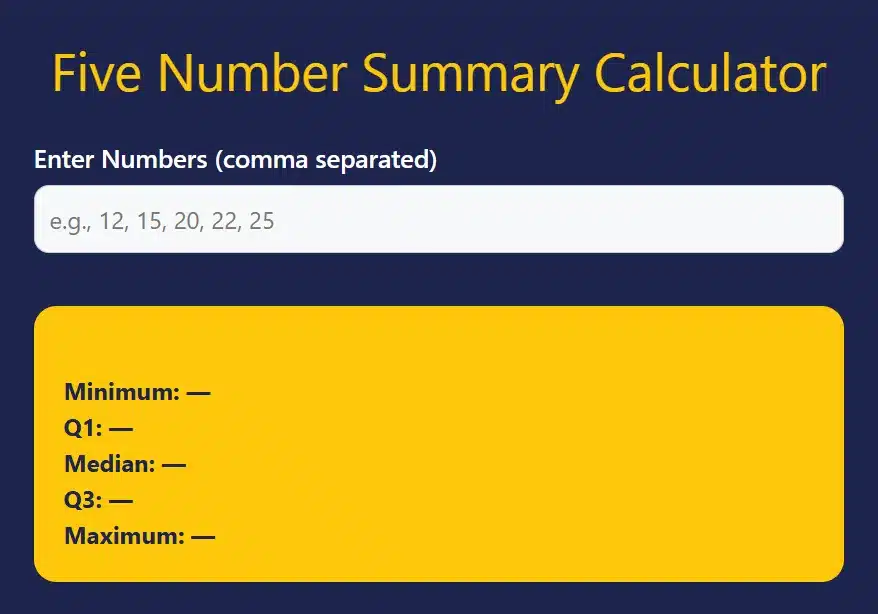
Step 1: Enter Your Numbers
See the form field that says “Enter Numbers (comma separated)”. Just enter your dataset values, each number separated by a comma. Example : 12,15,20,22,25 or 45,67,23,89,12,34,56.
Step 2: Click Calculate
Hit calculate after you have entered the numbers. Automatically, the tool arranges your data while calculating statistical specs at once.
Step 3: Read Your Results
Your five number summary will automatically write in your results box in yellow:
• Minimum (Threshold Value): The least value you want to accept from the dataset
• Q1(First Quartile) : Value below which 25% of your data falls
• Median: The value that cuts your data in half
• Q3 (Third Quartile): this is where 75% of your data falls at or below
• Highest: The highest value in your data set.
Now consider — remember all of that sorting, counting and the multitude of calculations? Those are automatic now. Pretty amazing, right?
When You Would Use a Five Number Summary Calculator
You might ask, “Can’t I just do this myself?” Maybe, but let me explain why this tool knocks the socks off traditional methods:
Speed and efficiency: Manual calculation may take 10 to 15 minutes for bigger data. It displays the results in less than a second so you can concentrate on interpreting the data instead of number-crunching.
Error-proof: Hand calculations are notorious for counting positions, especially with odd/even dataset sizes. Our system eliminates such errors altogether.
Can Take Complex Data: Good luck adding 50+ numbers to the front in your head! This is a tool which can handle large datasets easily and hence it is ideal for when you need to find the five number summary of an enormous amount of research data.
Professional Reliability: Adding the four or five decimal numbers that are consistent with basic calculators can be a pain and often result in keying errors from miscounting decimal places.
Use Cases: Who Should use This Tool?
This five number summary calculator caters to the different needs of the users in different walks of life such as:
Students and Educators Ideal for statistics courses, homework, teaching demonstrations. Teachers can form examples rapidly, while the students check their manual calculations.
Research Scientists: You need to get your five number summary for more than one variable in experimental studies, survey polls and statistical research.
Business Analysts: Perfect for market resesearch, sales data statistics and performance metrics analysis. Fast statistical summaries allow you to identify trends, outliers and patterns.
Quality Control Technicians: Production and manufacturing shops that use SPC to monitor a process and where regular five number summary of measurents is needed.
Medical Personnel: Medical researchers working on patient records, trial results, or epidemiological studies can take advantage of timely statistical summarization.
A Little Introduction of My Experience and the Tool
I know, full honesty – this calculator has changed my life in data analysis. There was this particular project with customer satisfaction scores that needed processing from 200+ respondents. You’d think I spent hours manually sorting and calculating quartiles, but this tool did it all in seconds.
What blew me away, though, was how seamlessly it coped with fractional and negative numbers. I recall giving it a messy data set with such values as -12.5, 0, 15.7, –3.2 and it did all that beautifully.”
The visual display is crisp and professional — great for use in reports or presentations. It might make your statistical analysis easier as well – you should mention testing it now!
Frequently Asked Questions
How to calculate 5 number summary by hand?
Arrange your data in increasing order and find: minimum (first Q), Q1 (25th percentile), median or Q2 (50th percentile), Q3 (75th percentile) and maximum (last value). Our calculator does this automatically!
Q1 vs Q3: What’s the difference?
Q1 (which is the first quartile) is the median of your lower half and Q3 (the third quartile) is the median of your upper half. Together, they illustrate how your data is spread around the median.
Can I use decimal numbers?
Absolutely! You can enter decimal numbers like 12.5,.75 or 99.99 – the calculator works perfectly with any number format.
How can you find the Five Number Summary for small data sets?
In fact, even 5 numbers can give you a lot of information – after all, this is the “five number summary. Our tool is applicable to any dataset size, from tiny samples to hundreds of measurements.
But does this work in my case if I have duplicate entries?
No problem! The calculator treats repeated values as it should do and will include repeated values in the quartile formulae via standard statistical methods.
Is the order in which numbers are entered relevant?
Not at all! Type in numbers however you like – the tool will automatically order them before displaying the results.
Can I paste the results into reports?
Yes! The results are presented in an easy-to-copy format to use in documents, spreadsheets or presentations.
Related Tools
You can take your statistical analysis to the next level with a range of calculators:
• Decimal Calculator : Ideal for accurate decimal arithmetic with your statistical calculations
• Distributive Property Calculator : Handy for working through advanced statistical formulas with algebra_definitions/functions_articles/distributive_property.defs.defs.example.opensource at master · mathispower4u/algebra_definitions_functions_articlesThis is because even long chains of operations should have a shortcut.
• Partial Derivative Calculator: An important tool useful for advanced statistical modelling and optimization
• Percent Error Calculator: Find accuracy of statistical estimates relative to true values.
Conclusion
This five number summary calculator simplifies the calculation of the five number summary of your statistical sample! Student of statistics or professional analyst, you’ll get results from this tool almost as fast as your pocket calculator.
No need to struggle with mathematics and human error. Give our 5 number summary calculator a try this instant – your data analysis process will never be the same!
Check out latest updates & share!
Check out latest updates & share!